Empowering
professionals with
real-time data insights
Sensor data analytics and infrastructure intelligence solutions created by industry leading experts.


Condition Monitoring Report 2023 – Download now.
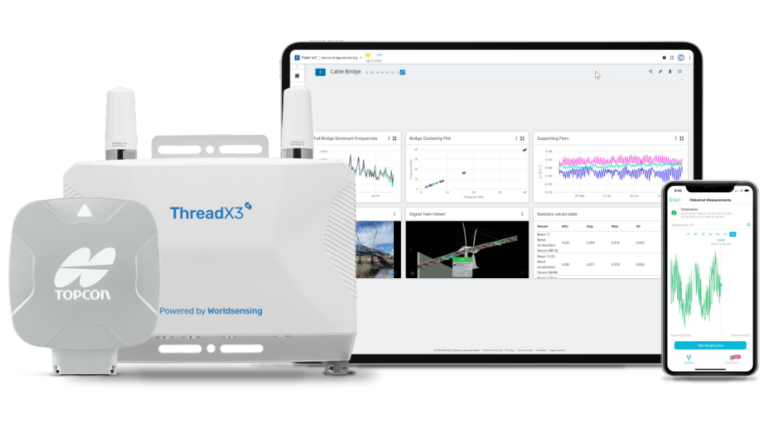
Complete solution to monitor, analyze and
manage all sensor data

Integrate with any sensor and IoT device required by your project — no vendor lock-in

Make sense of your data with powerful dashboards, visualizations, and analytics tools

React instantly to critical sensor readings with custom alarm notifications

Keep all stakeholders informed with custom alarm notifications with fine-grained user roles and customized reports
With 30+ years of experience across industries, we’ve built a platform that fits the unique needs of each industry
Dams
Use it with any project, of any size.
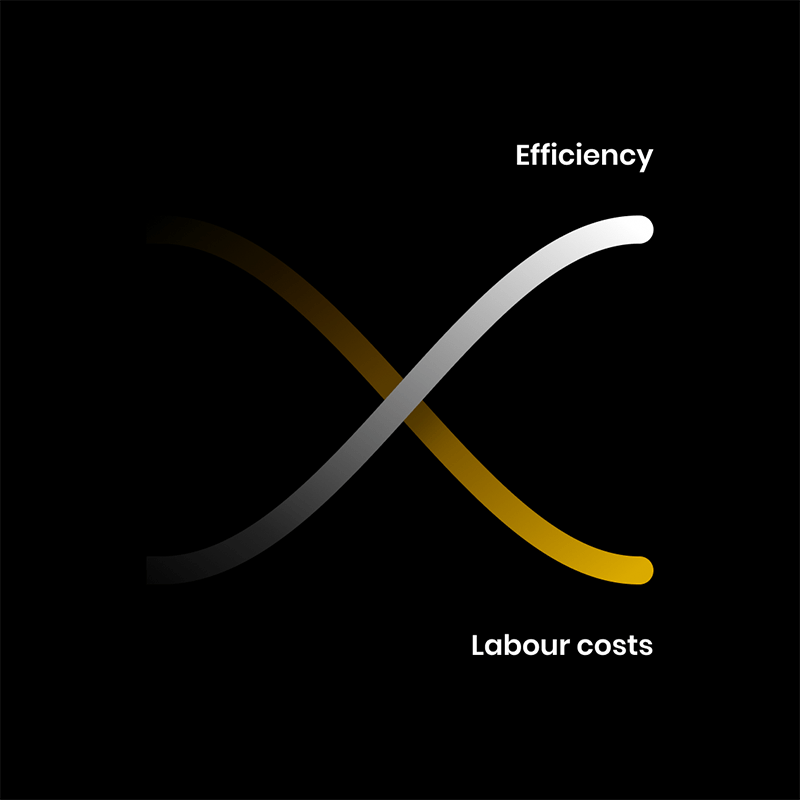
Cost effective. Improve operational efficiency and drastically reduce labor costs
Intuitive to use for all stakeholders
Fully automated
No matter your size. Be able to do your best work at any size of your company
Single or multiple projects
Tiered pricing plans
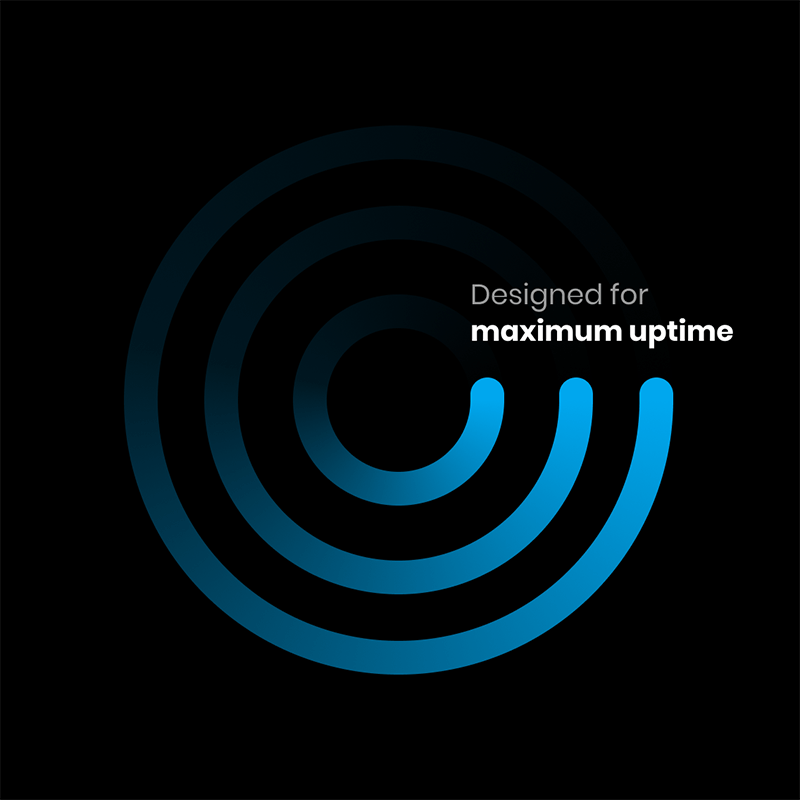
Reliable, responsive & secure. Ensure maximum uptime and security of your data
Cloud or local/offline installation
Built on the highest level of Security, Privacy and Compliance standards ensured by the Bentley Trust Center
No Vendor lock-in. Integrate with any sensor, IoT device, or data logger
| Supports all manufacturers |

Support for field data collection and manual data entry.
| Supports all manufacturers |
Get started. Our team of experts is here to help you.
Expert consultancy
Pilots or large projects
Worldwide support

Alan Jones
Senior Director, BD

Alex Pienaar
Senior Director, Sales
Latest news
View all ![]()
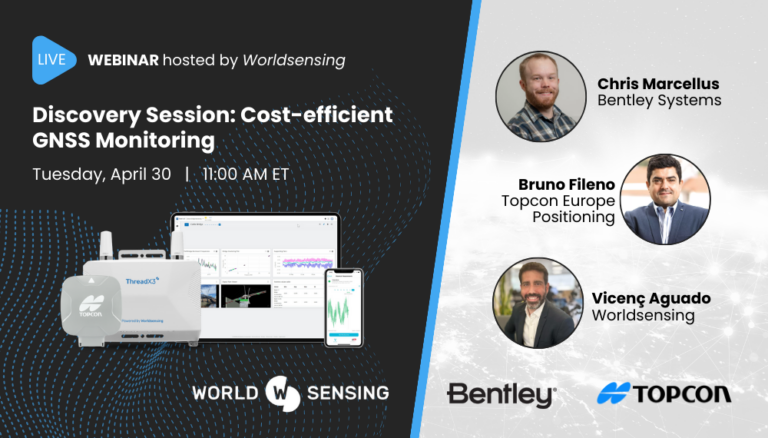
Join Us for a Live Webinar with Worldsensing and Topcon Positioning Systems
Strategic Agreements Integrate Topcon Technology into Solutions from Bentley Systems and Worldsensing
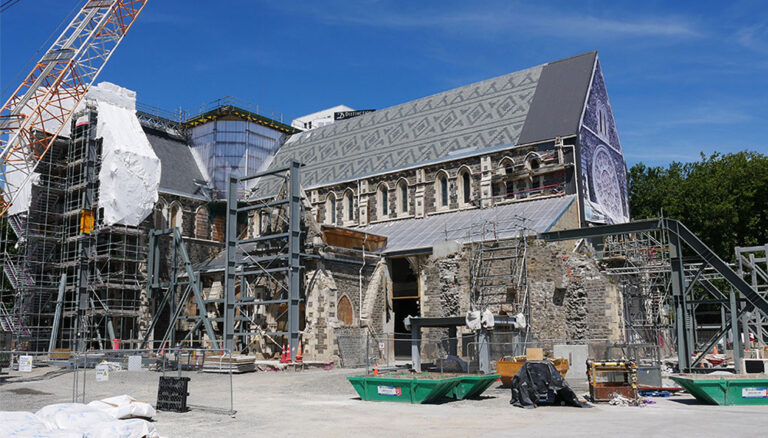
Rising from the Rubble: Christ Church Cathedral’s Journey to Restoration
View all ![]()